| Fundamentals of Statistics contains material of various lectures and courses of H. Lohninger on statistics, data analysis and chemometrics......click here for more. |
|
Home  General Processing Steps Visualization 3D Plots General Processing Steps Visualization 3D Plots |
|||||
| See also: Scatter Plots |   |
||||
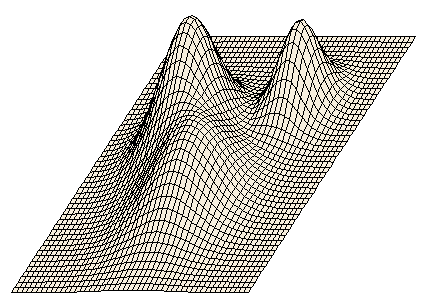
3D Plots
In order to better understand the importance of 3D plots, you may start
the interactive example by clicking at the figure on the left.
|
|||||
| Home General Processing Steps Visualization 3D Plots |
|
||||