| Fundamentals of Statistics contains material of various lectures and courses of H. Lohninger on statistics, data analysis and chemometrics......click here for more. |

|
Home  Bivariate Data Correlation Introduction Bivariate Data Correlation Introduction |
|
| See also: autocorrelation, Challenger disaster, correlation coefficient, covariance |   |
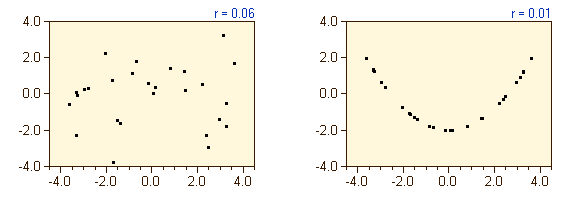
CorrelationThe aim of correlation analysis is to detect relationships among variables. We have to keep in mind that the term "correlation" usually means "linear correlation". The measure of linear correlation is the correlation coefficient. The importance of correlation is sometimes overestimated, since people often do not know the restrictions and the implications of a high correlation. On the other hand, a correlation coefficient of zero does not necessarily mean that there is no relationship between two variables, as is shown in the figure below. The left figure shows an uncorrelated data set, whereas the right diagram shows a perfect parabolic relationship, although the correlation coefficient in both cases is close to zero.
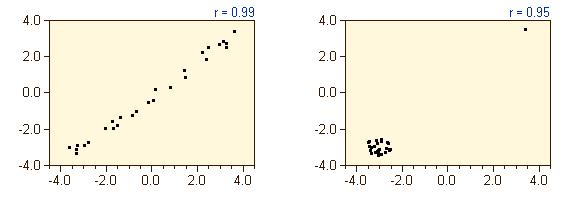
And again, a high correlation coefficient may not be due to high correlation within the data (as in the left figure below), but may be due to a single outlier which is located away from the uncorrelated rest of the data samples (right figure below).
In general, it is a good idea to have a look at the corresponding scatter plots in order to avoid any misinterpretation. More examples on correlations can be found elsewhere.
|
|
| Home Bivariate Data Correlation Introduction |
|