| Fundamentals of Statistics contains material of various lectures and courses of H. Lohninger on statistics, data analysis and chemometrics......click here for more. |

|
Home  Multivariate Data Modeling Classification and Discrimination Cluster Analysis Dendrograms Multivariate Data Modeling Classification and Discrimination Cluster Analysis Dendrograms |
|
| See also: cluster analysis |   |
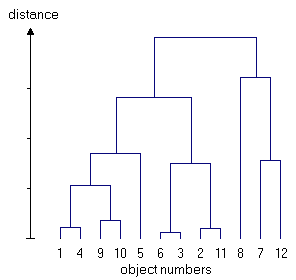
DendrogramsDendrograms are often used for displaying relationships among clusters. A dendrogram shows the multidimensional distances between objects in a tree-like structure. Objects which are closest to each other in the multidimensional data space are connected by a horizontal line, forming a cluster which can be regarded as a "new" object. The new cluster and the remaining original data are again searched for the closest pair, and so on. The distance of the particular pair of objects (or clusters) is reflected in the height of the horizontal line.
|
|
| Home Multivariate Data Modeling Classification and Discrimination Cluster Analysis Dendrograms |
|