| Fundamentals of Statistics contains material of various lectures and courses of H. Lohninger on statistics, data analysis and chemometrics......click here for more. |

|
Home  Multivariate Data Optimization Visualization of the Response Function Multivariate Data Optimization Visualization of the Response Function |
|
| See also: response function |   |
Optimization - Visualization of the Response Function
Response functions are often very complex and depend on several variables,
which prevents their visualization. In fact, an optimization problem could
quickly be solved if the response function could be plotted.
|
|
| Home Multivariate Data Optimization Visualization of the Response Function |
|
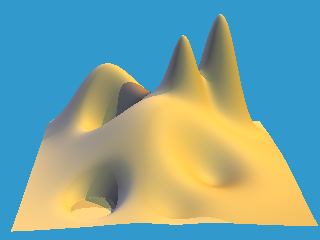 It is important to keep in mind that the researcher does not usually know
much about the response surface of the search problem. One could compare
this situation to finding the peak of a particular landscape in a dense
fog. This fog will prevent the climber from seeing the whole landscape,
so she has to decide from that which can be observed in the vicinity where
to go next in order to find the maximum. This may well result in a situation
where the climber may reach a top which is not the highest peak. This is
a very important point and one of the major problems in optimization tasks.
Very often (especially in complex systems) it is even impossible to detect
whether one reached the global optimum or just a local one.
It is important to keep in mind that the researcher does not usually know
much about the response surface of the search problem. One could compare
this situation to finding the peak of a particular landscape in a dense
fog. This fog will prevent the climber from seeing the whole landscape,
so she has to decide from that which can be observed in the vicinity where
to go next in order to find the maximum. This may well result in a situation
where the climber may reach a top which is not the highest peak. This is
a very important point and one of the major problems in optimization tasks.
Very often (especially in complex systems) it is even impossible to detect
whether one reached the global optimum or just a local one.