| Fundamentals of Statistics contains material of various lectures and courses of H. Lohninger on statistics, data analysis and chemometrics......click here for more. |

|
Home  Univariate Data Moments of a Distribution Skewness Univariate Data Moments of a Distribution Skewness |
|||
| See also: kurtosis, moments of a distribution |   |
||
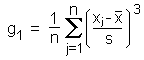
SkewnessA distribution is said to be skewed to the right (left) if it shows a tailing at the right (left) end. The amount of skewing can be determined by the third moment of the distribution, which is usually called skewness:
In order to test, whether the calculated sample skewness originates from a skewed distribution, the following test statistic may be calculated:
If the test statistic Zn exceeds the (1-
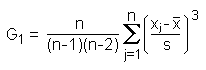
Please note that the skewness is occasionally defined by a somewhat different formula, leading to different values. Below you find two examples of skewed distributions. You may also start the following interactive example in order to see the effect of skewed distributions on the mean and the median.
|
|||
| Home Univariate Data Moments of a Distribution Skewness |
|
||

 /2) quantile of the standard