Outlier Test - Dean and Dixon
A test for outliers of normally distributed data which is particularly simple to apply has been developed by J.W. Dixon.  This test is eminently suitable for small sample sizes; for samples having more than 30 observations the test for significance of Pearson and Hartley can be used as well. In order to perform the Dean-Dixon test for outliers, the data set containing N values has to be sorted either in an ascending or descending order, with x1 being the suspect value. Then the test statistic Q is calculated using the equation This test is eminently suitable for small sample sizes; for samples having more than 30 observations the test for significance of Pearson and Hartley can be used as well. In order to perform the Dean-Dixon test for outliers, the data set containing N values has to be sorted either in an ascending or descending order, with x1 being the suspect value. Then the test statistic Q is calculated using the equation
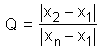
The decision whether x1 is an outlier is performed by comparing
the value Q to the critical values listed in the following table (N is the number of observations, α is the level of significance): If the calculated value of Q is greater than the critical threshold the corresponding data value x1 is regarded to be an outlier.
| N | α=0.001 | α=0.002 | α=0.005 | α=0.01 | α=0.02 | α=0.05 | α=0.1 | α=0.2 |
| 3 | 0.999 | 0.998 | 0.994 | 0.988 | 0.976 | 0.941 | 0.886 | 0.782 |
| 4 | 0.964 | 0.949 | 0.921 | 0.889 | 0.847 | 0.766 | 0.679 | 0.561 |
| 5 | 0.895 | 0.869 | 0.824 | 0.782 | 0.729 | 0.643 | 0.559 | 0.452 |
| 6 | 0.822 | 0.792 | 0.744 | 0.698 | 0.646 | 0.563 | 0.484 | 0.387 |
| 7 | 0.763 | 0.731 | 0.681 | 0.636 | 0.587 | 0.507 | 0.433 | 0.344 |
| 8 | 0.716 | 0.682 | 0.633 | 0.591 | 0.542 | 0.467 | 0.398 | 0.314 |
| 9 | 0.675 | 0.644 | 0.596 | 0.555 | 0.508 | 0.436 | 0.370 | 0.291 |
| 10 | 0.647 | 0.614 | 0.568 | 0.527 | 0.482 | 0.412 | 0.349 | 0.274 |
| 15 | 0.544 | 0.515 | 0.473 | 0.438 | 0.398 | 0.338 | 0.284 | 0.220 |
| 20 | 0.491 | 0.464 | 0.426 | 0.393 | 0.356 | 0.300 | 0.251 | 0.193 |
| 25 | 0.455 | 0.430 | 0.395 | 0.364 | 0.329 | 0.277 | 0.230 | 0.176 |
| 30 | 0.430 | 0.407 | 0.371 | 0.342 | 0.310 | 0.260 | 0.216 | 0.165 |
Please note that Dean and Dixon suggested in a later paper to take a more elaborate approach by using different formulas for different sample sizes in order to avoid the problem of two outliers on the same side of the distribution. They defined the following ratios and recommended that the various ratios be applied as follows: for 3 <= N <=7 use r10; for 8 <= N <=10 use r11; for 11 <= N <= 13 use r21, and for n >= 14 use r22:
The following tables show the critical values for r11, r21, and r22, respectively. r10 is equal to Q, its critical values can be obtained from the table above.
Critical values for r11
| N | α=0.001 | α=0.002 | α=0.005 | α=0.01 | α=0.02 | α=0.05 | α=0.1 | α=0.2 |
| 8 | 0.799 | 0.769 | 0.724 | 0.682 | 0.633 | 0.554 | 0.480 | 0.386 |
| 9 | 0.750 | 0.720 | 0.675 | 0.634 | 0.586 | 0.512 | 0.441 | 0.352 |
| 10 | 0.713 | 0.683 | 0.637 | 0.597 | 0.551 | 0.477 | 0.409 | 0.325 |
Critical values for r21
| N | α=0.001 | α=0.002 | α=0.005 | α=0.01 | α=0.02 | α=0.05 | α=0.1 | α=0.2 |
| 11 | 0.770 | 0.746 | 0.708 | 0.674 | 0.636 | 0.575 | 0.518 | 0.445 |
| 12 | 0.739 | 0.714 | 0.676 | 0.643 | 0.605 | 0.546 | 0.489 | 0.420 |
| 13 | 0.713 | 0.687 | 0.649 | 0.617 | 0.580 | 0.522 | 0.467 | 0.399 |
Critical values for r22
| N | α=0.001 | α=0.002 | α=0.005 | α=0.01 | α=0.02 | α=0.05 | α=0.1 | α=0.2 |
| 14 | 0.732 | 0.708 | 0.672 | 0.640 | 0.603 | 0.546 | 0.491 | 0.422 |
| 15 | 0.708 | 0.685 | 0.648 | 0.617 | 0.582 | 0.524 | 0.470 | 0.403 |
| 16 | 0.691 | 0.667 | 0.630 | 0.598 | 0.562 | 0.505 | 0.453 | 0.386 |
| 17 | 0.671 | 0.647 | 0.611 | 0.580 | 0.545 | 0.489 | 0.437 | 0.373 |
| 18 | 0.652 | 0.628 | 0.594 | 0.564 | 0.529 | 0.475 | 0.424 | 0.361 |
| 19 | 0.640 | 0.617 | 0.581 | 0.551 | 0.517 | 0.462 | 0.412 | 0.349 |
| 20 | 0.627 | 0.604 | 0.568 | 0.538 | 0.503 | 0.450 | 0.401 | 0.339 |
| 25 | 0.574 | 0.550 | 0.517 | 0.489 | 0.457 | 0.406 | 0.359 | 0.302 |
| 30 | 0.539 | 0.517 | 0.484 | 0.456 | 0.425 | 0.376 | 0.332 | 0.278 |
| 35 | 0.511 | 0.490 | 0.459 | 0.431 | 0.400 | 0.354 | 0.311 | 0.260 |
| 40 | 0.490 | 0.469 | 0.438 | 0.412 | 0.382 | 0.337 | 0.295 | 0.246 |
| 45 | 0.475 | 0.454 | 0.423 | 0.397 | 0.368 | 0.323 | 0.283 | 0.234 |
| 50 | 0.460 | 0.439 | 0.410 | 0.384 | 0.355 | 0.312 | 0.272 | 0.226 |
| 60 | 0.437 | 0.417 | 0.388 | 0.363 | 0.336 | 0.294 | 0.256 | 0.211 |
| 70 | 0.422 | 0.403 | 0.374 | 0.349 | 0.321 | 0.280 | 0.244 | 0.201 |
| 80 | 0.408 | 0.389 | 0.360 | 0.337 | 0.310 | 0.270 | 0.234 | 0.192 |
| 90 | 0.397 | 0.377 | 0.350 | 0.326 | 0.300 | 0.261 | 0.226 | 0.185 |
| 100 | 0.387 | 0.368 | 0.341 | 0.317 | 0.292 | 0.253 | 0.219 | 0.179 |
| Hint: |
Please note that the critical values listed in the tables above have been calculated by performing 106 random experiments per value. These values differ slightly from values published by various authors, many of them using interpolation techniques to estimate the critical values. |
|

 Statistical Tests