Two-Sample F-Test
In order to compare two methods, it is often important to know whether
the variabilities for both methods are the same. In order to compare two
variances v1, and v2, one has to calculate the ratio
of the two variances. This ratio is called the F-statistic (in honor of
R.A. Fisher) and follows an F distribution:
F = v1/v2
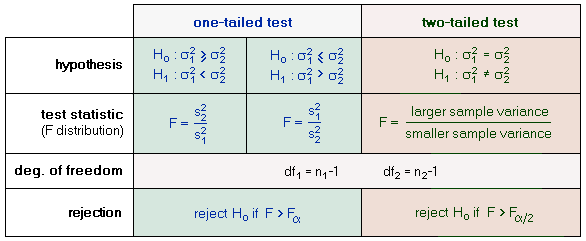
The null hypothesis H0 assumes that the variances are equal
and the ratio F is therefore one. The alternative hypothesis H1
assumes that v1 and v2 are different, and that the ratio deviates from unity. The F-test is based on two assumptions:
(1) the samples are normally distributed, and (2) the samples are independent
of each other. If these assumptions are fulfilled and H0 is
true, the statistic F follows an F-distribution. The following is a decision
table for the application of an F-test. In order to calculate the F-quantile,
or an associated probability, refer to an F table, or to the distribution
calculator.
Remarks:
-
When the normality assumption is not fulfilled, one should use a non-parametric
method. In general the F-test is more sensitive to deviations from normality
than the t-test.
-
The F-test can be used to check the equal variance assumption needed for
the two sample t-test, but the non-rejection of H0 does not imply that
the assumption (of equal variance) is valid, since the probability
of the type 2 error is unknown.
| Example: |
Suppose you have two series of measurements, one with 10 observations,
and one with 13 observations. The variance of the first series is 0.88,
and the variance of the second series is 1.79. Is the variance of the second
series significantly larger than the variance of the first series (at a
significance level of 0.05)?
In order to check this, we assume the null hypothesis that the variance
of the second series is not larger than the variance of the first
series. The alternative hypothesis would be that the second variance is
indeed larger than the first one. Next we have to calculate the F statistic:
F = 1.79/0.88 = 2.034. Now we can compare the F statistic with the critical
value at a 5 percent level of significance. By using the distribution
calculator we find a critical value of 3.073. Since F is only 2.034
we cannot reject our null hypothesis (the second variance is not significantly
larger than the first one). |
|

 Statistical Tests
