| Fundamentals of Statistics contains material of various lectures and courses of H. Lohninger on statistics, data analysis and chemometrics......click here for more. |

|
Home  Statistical Tests Comparing Distributions Shapiro-Wilk Test Statistical Tests Comparing Distributions Shapiro-Wilk Test |
||||||||||||||||||||||||||||||||||||||||||||||||||||||||||||||||||||||||||||||||||||||||
| See also: Normal Distribution, Test for Normality, Kolmogorov-Smirnov One-Sample Test |   |
|||||||||||||||||||||||||||||||||||||||||||||||||||||||||||||||||||||||||||||||||||||||
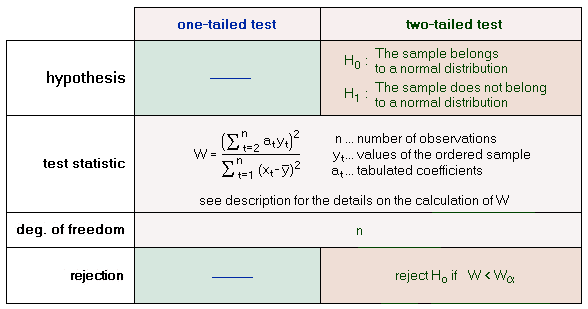
Shapiro-Wilk Test
The Shapiro-Wilk test The basis idea behind the Shapiro-Wilk test is to estimate the variance of the sample in two ways: (1) the regression line in the QQ-Plot allows to estimate the variance, and (2) the variance of the sample can also be regarded as an estimator of the population variance. Both estimated values should approximately equal in the case of a normal distribution and thus should result in a quotient of close to 1.0. If the quotient is significantly lower than 1.0 then the null hypothesis (of having a normal distribution) should be rejected.
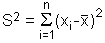
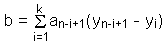
In order to calculate the statistic W one has to perform the following procedure:
|
||||||||||||||||||||||||||||||||||||||||||||||||||||||||||||||||||||||||||||||||||||||||
| Home Statistical Tests Comparing Distributions Shapiro-Wilk Test |
|
|||||||||||||||||||||||||||||||||||||||||||||||||||||||||||||||||||||||||||||||||||||||

 ,
,